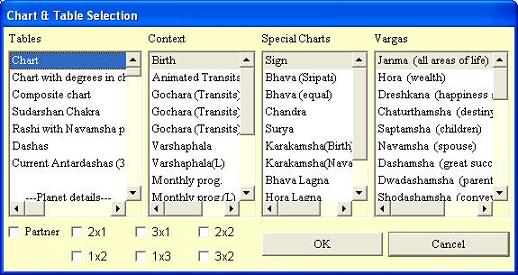
An incredible array of cells is available for the worksheet, from charts to tables to graphs. Because of the totally flexible way that you can combine the context, charts and vargas for a given cell, the number of different cells runs over 10,000.
The "Charts and Tables Selection" menu consists of 4 main sections: Tables, Context, Special Charts, and Vargas.
You can access the new vastly expanded "Charts and Tables Selection" menu by left clicking once on any worksheet cell area.
"Tables" contains an extensive list of all the kinds of chart, tables and graphs you can place on the worksheet.

"Context" determines the actual birth information (longitude, latitude, date and time) used for calculating the selected table.
"Special Charts" determines the house system and/or special lagna used for calculating/drawing the selected Chart, Table or Graph.
"Vargas" specifies which divisional chart is used, in case "Rashi" is selected under "Special charts" (for the other house systems the vargas do not make sense).


